As more than two years have passed since we launched this blog and we experienced the nice feeling of seeing that other people might find interesting some of the things we like we figured that we might share some details about what was in fact our audience in this time.
We started sharing our ideas as a way to keep doing the kind of things we like while we are not working on projects for our customers and, as the time passed, we found this to be a very rewarding habit. I guess that we, as developers, like to feel that our work is appreciated by others. From the start we only followed two rules about the content of our blog:
- we won’t share code that was built for a client upon demand
- we won’t place ads on this blog, keeping it just a hobby for us and not a revenue source
So all our articles came from the personal interest in some subjects of some of the developers that work for this company. This is how in time we published small scripts with a focused purpose like the simple script to ban an IP address or full solutions like the sencha touch series. We also like to talk about how some technologies might be used like jsonp or the integration of the jQuery UI slider. We always had a strong personal note in our posts like the pride to announce the launch of our new design or an opinion on the comparison between MoSync and Phonegap.
I was very nice to see that the ideas we posted were shared by others and in some cases we were especially happy to see that some of the blog posts were given as suggested resources for problems posted on stackoverflow, or on the sencha forum. Most recently we were impressed to see that CAM’s ideas about mosync were featured on their official blog.
Since we are proud about the way this blog evolved we figured we might share a bit of general details about our audience in the form of 3 top 5 lists of some key elements: browsers usage, operating systems and countries.
We can say for sure that the majority of our visitors are web developers so we figured we might also compare our findings with some general statistics. To do this we chose as trusted source for two of the rankings the w3schools statistics. Even if you might argue that they don’t provide the best learning resources I think we can all agree that they do have the data to show some relevant statistics. As we all know these numbers are estimative only anyway, since 100% true tracking is (almost) impossible.
So to start we will talk about one of the most discussed themes about the web interaction: the browser wars. From the stats we have about our visitors our top 5 would be:
- Chrome: 54.18%
- Firefox: 30.68%
- Safari: 6.85%
- Internet Explorer: 5.09%
- Opera: 1.89%
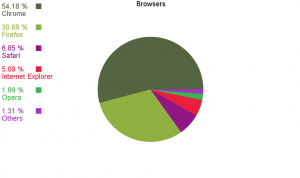
Browsers Pie Chart
Comparing these values to the ones released by w3schools for January 2013 we will see that their top would be:
- Chrome: 48.4%
- Firefox: 30.2%
- Internet Explorer: 14.3%
- Safari: 4.2%
- Opera: 1.9%
So from comparing these two we can say that our blog readers tend to use Chrome, Firefox and Safari more than the global average. The usage of IE is the only one (way) lower and it is interesting to see that Opera has a very similar popularity among our visitors and the general public. We might argue that this would be in fact expected if we assume that the majority of our visitors are web developers but remember: the purpose of this blog post is not to start a fight between users of different solutions :).
The second list we could share is the top of operating systems:
- Windows: 72.96%
- Macintosh: 14.37%
- Linux: 8.57%
- iOS: 2.42%
- Android: 1.32%
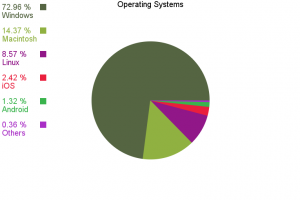
Operating Systems Pie Chart
Even if it doesn’t report the same data the w3schools top would be
- Win7: 55.2%
- WinXP: 19.9%
- Mac: 9.3%
- Linux: 4.8%
- Win8: 4.8%
- Vista: 2.6%
- Moble: 2.2%
The reason why I used the full top 7 list from w3schools is that I would like to give headaches to the statistics experts and try to do a forced unification of formats. So our top would “translate” to:
- Windows: 72.96%
- Macintosh: 14.37%
- Linux: 8.57%
- Mobile: 3.74%
And the one from w3schools:
- Windows: 82.5%
- Macintosh: 9.3%
- Linux: 4.8%
- Mobile: 2.2%
In conclusion it seems that our readers tend to use more than the average operating systems like Mac or Linux and the Windows market share drops almost 10% from 82.5 to 72.96. Maybe this would have been expected for the web development niche but to me personally it seemed strange that a technical blog would be read from mobile devices more than the average. That was until I realized that I am doing this everyday too.
The last stats I would talk about would be the source country and since this is not shared by w3schools and we could not find anything similar we figured we might trust the wikipedia list of countries by number of Internet users.
The top five countries that bring traffic to this blog are:
- India: 18.46%
- United States: 12.02%
- Germany: 4.37%
- United Kingdom: 3.75%
- Romania: 3.59%
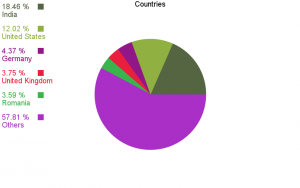
Countries Pie Chart
The global list of internet users has this top 5:
- China
- United States
- India
- Japan (our #43)
- Brazil (or #8)
This also seems understandable from the development point of view as most of us know that a lot of developers come from India. And our entire top 5 shows only countries that are known to be very active in the web development ecosystem. The biggest differences are for Romania (or 5th, global 38th) and Japan (global 4th, our 43rd).
This would be an overview of who most of our readers are, it is not meant to mean anything in particular, it is just an anniversary announcement: we figured that until now we got enough traffic so that our input on this might be a bit relevant at least to the casual reader.
Please feel free to share with us your preferences in browsers or operating systems and maybe your location. If you are a website owner we would appreciate it if you would share similar info (at least the 1st places) with a mention of your niche.
If you liked this post
you can buy me a beer


